Sharpe
2.551
Provided summary: 2.378
CAGR
23.85%
Provided summary: 24.13%
Annual Vol
8.53%
Provided summary: 9.28%
Max Drawdown
-7.97%
Provided summary: -8.56%
Recomputed Performance
| Period | 2000-01-03 to 2026-03-03 |
| Years | 27.1 |
| Calmar | 2.991 |
| Sortino | 3.237 |
| VaR 95% | -0.65% |
| CVaR 95% | -1.12% |
| Best Day | 4.18% |
| Worst Day | -3.66% |
Average Gross Allocation
| Asset Class | Instruments | Allocation |
|---|---|---|
| Equity Index | 28 | 32.23% |
| Fixed Income | 16 | 27.08% |
| Agricultural | 10 | 12.86% |
| Currencies | 9 | 10.26% |
| Metals | 7 | 8.68% |
| Energy | 6 | 7.61% |
| Other | 2 | 1.28% |
Closest Local Candidates
| Candidate | Sharpe | CAGR | Vol | Max DD |
|---|---|---|---|---|
| p10_lowvol_best_phase3 | 2.551 | 23.85% | 8.53% | -7.97% |
| p10_lowvol_best_phase3_short_030 | 2.614 | 27.02% | 9.32% | -8.80% |
| best_base_best_phase3 | 2.234 | 39.48% | 15.43% | -15.42% |
| best_base_best_phase3_short_030 | 2.397 | 41.17% | 14.85% | -17.28% |
Ranking is based on closeness to the supplied summary across Sharpe, CAGR, annual volatility, and max drawdown.
Public Data Stock Prototype
Data Source
yfinance
Auto-adjusted daily closes
Sharpe
0.421
2001-01-02 to 2026-05-12
CAGR
4.05%
30 current large-cap stocks
Max Drawdown
-28.35%
5 bps turnover cost
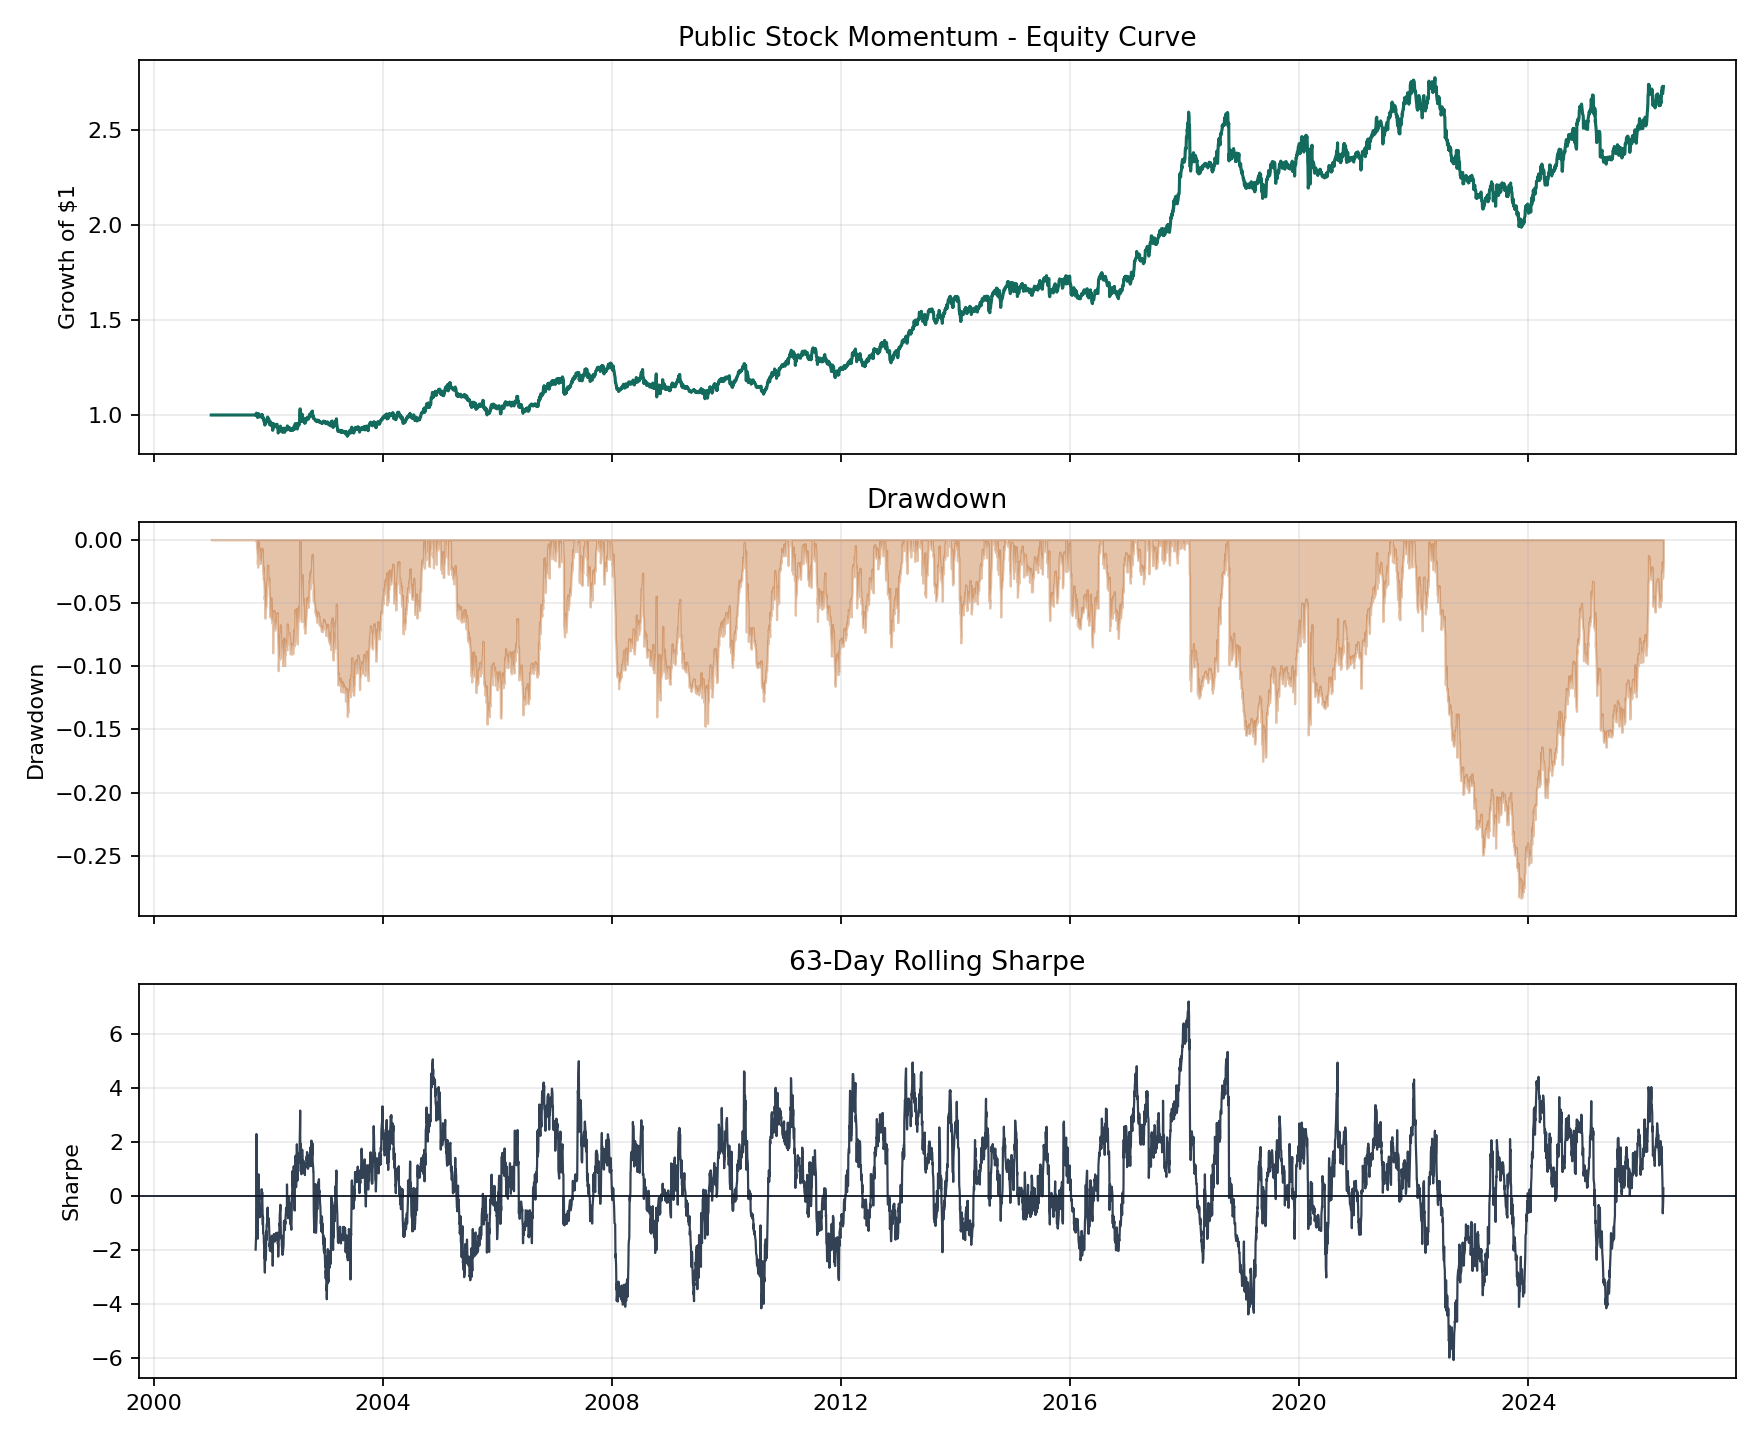
This is deliberately simple and reproducible: large-cap stock universe, multi-lookback momentum, inverse-volatility sizing, weekly Friday rebalance, 10% target volatility, and 5 bps turnover cost. It has survivorship bias because the universe is fixed to current large-cap stocks.
Quarterly 63-Day Window Test
| Window End | 63D Return | 63D Vol | 63D Sharpe |
|---|---|---|---|
| 2024-09-30 | 6.53% | 11.02% | 2.35 |
| 2024-12-31 | 1.78% | 12.83% | 0.61 |
| 2025-03-31 | -2.17% | 11.03% | -0.74 |
| 2025-06-30 | -2.89% | 9.89% | -1.14 |
| 2025-09-30 | 2.61% | 10.43% | 1.04 |
| 2025-12-31 | 3.01% | 10.42% | 1.19 |
| 2026-03-31 | 6.23% | 10.71% | 2.31 |
| 2026-06-30 | 0.48% | 8.23% | 0.27 |
The full quarterly sample has 99 windows. Median 63-day Sharpe is 0.44; interquartile range is -0.84 to 1.51.
Data Files
The deployed directory contains only static outputs from this audit. It does not include source strategy code, credentials, caches, or raw proprietary datasets.
Metrics JSON
Allocation CSV
Candidate Scan CSV
Monthly Returns CSV
Yearly Returns CSV
Daily Returns CSV
Public Metrics JSON
Public Daily CSV
Rolling 63D CSV
Quarterly Windows CSV
Public Prices CSV
Current read: this local candidate is structurally close to the supplied ParaMOUNT description and lands in the same low-vol CTA family, but the exact investor-summary return stream has not been proven identical.